Renewables
Mapping all installed wind turbines in Denmark
Wind power in Denmark
In 2017, a world record 43.4% of all electricity consumption in Denmark was covered by wind power generated throughout the year. That makes Denmark an ideal place to study future scenarios of high penetatrion of renewables, which is at the focus of long term goals in many countries.
For my research at the Technical University of Denmark, I study fluctuations in the residual power which is calculated as the difference between renewable power generation and consumption. This analysis can be done on different scales within Denmark, to study how fluctuations in residual power change as more and more wind turbines (and farms) are aggregated on the power supply side.
So where are they?
On the website of “Energistyrelsen”, one can find a list of all wind turbines currently installed in Denmark, with information attached such as their capacity and position. By reading that data into a pandas dataframe and using the basemap python module, we can get an overview of where all turbines are installed, here color-coded by regions relevant for my analysis (DK1, DK2 and Bornholm):
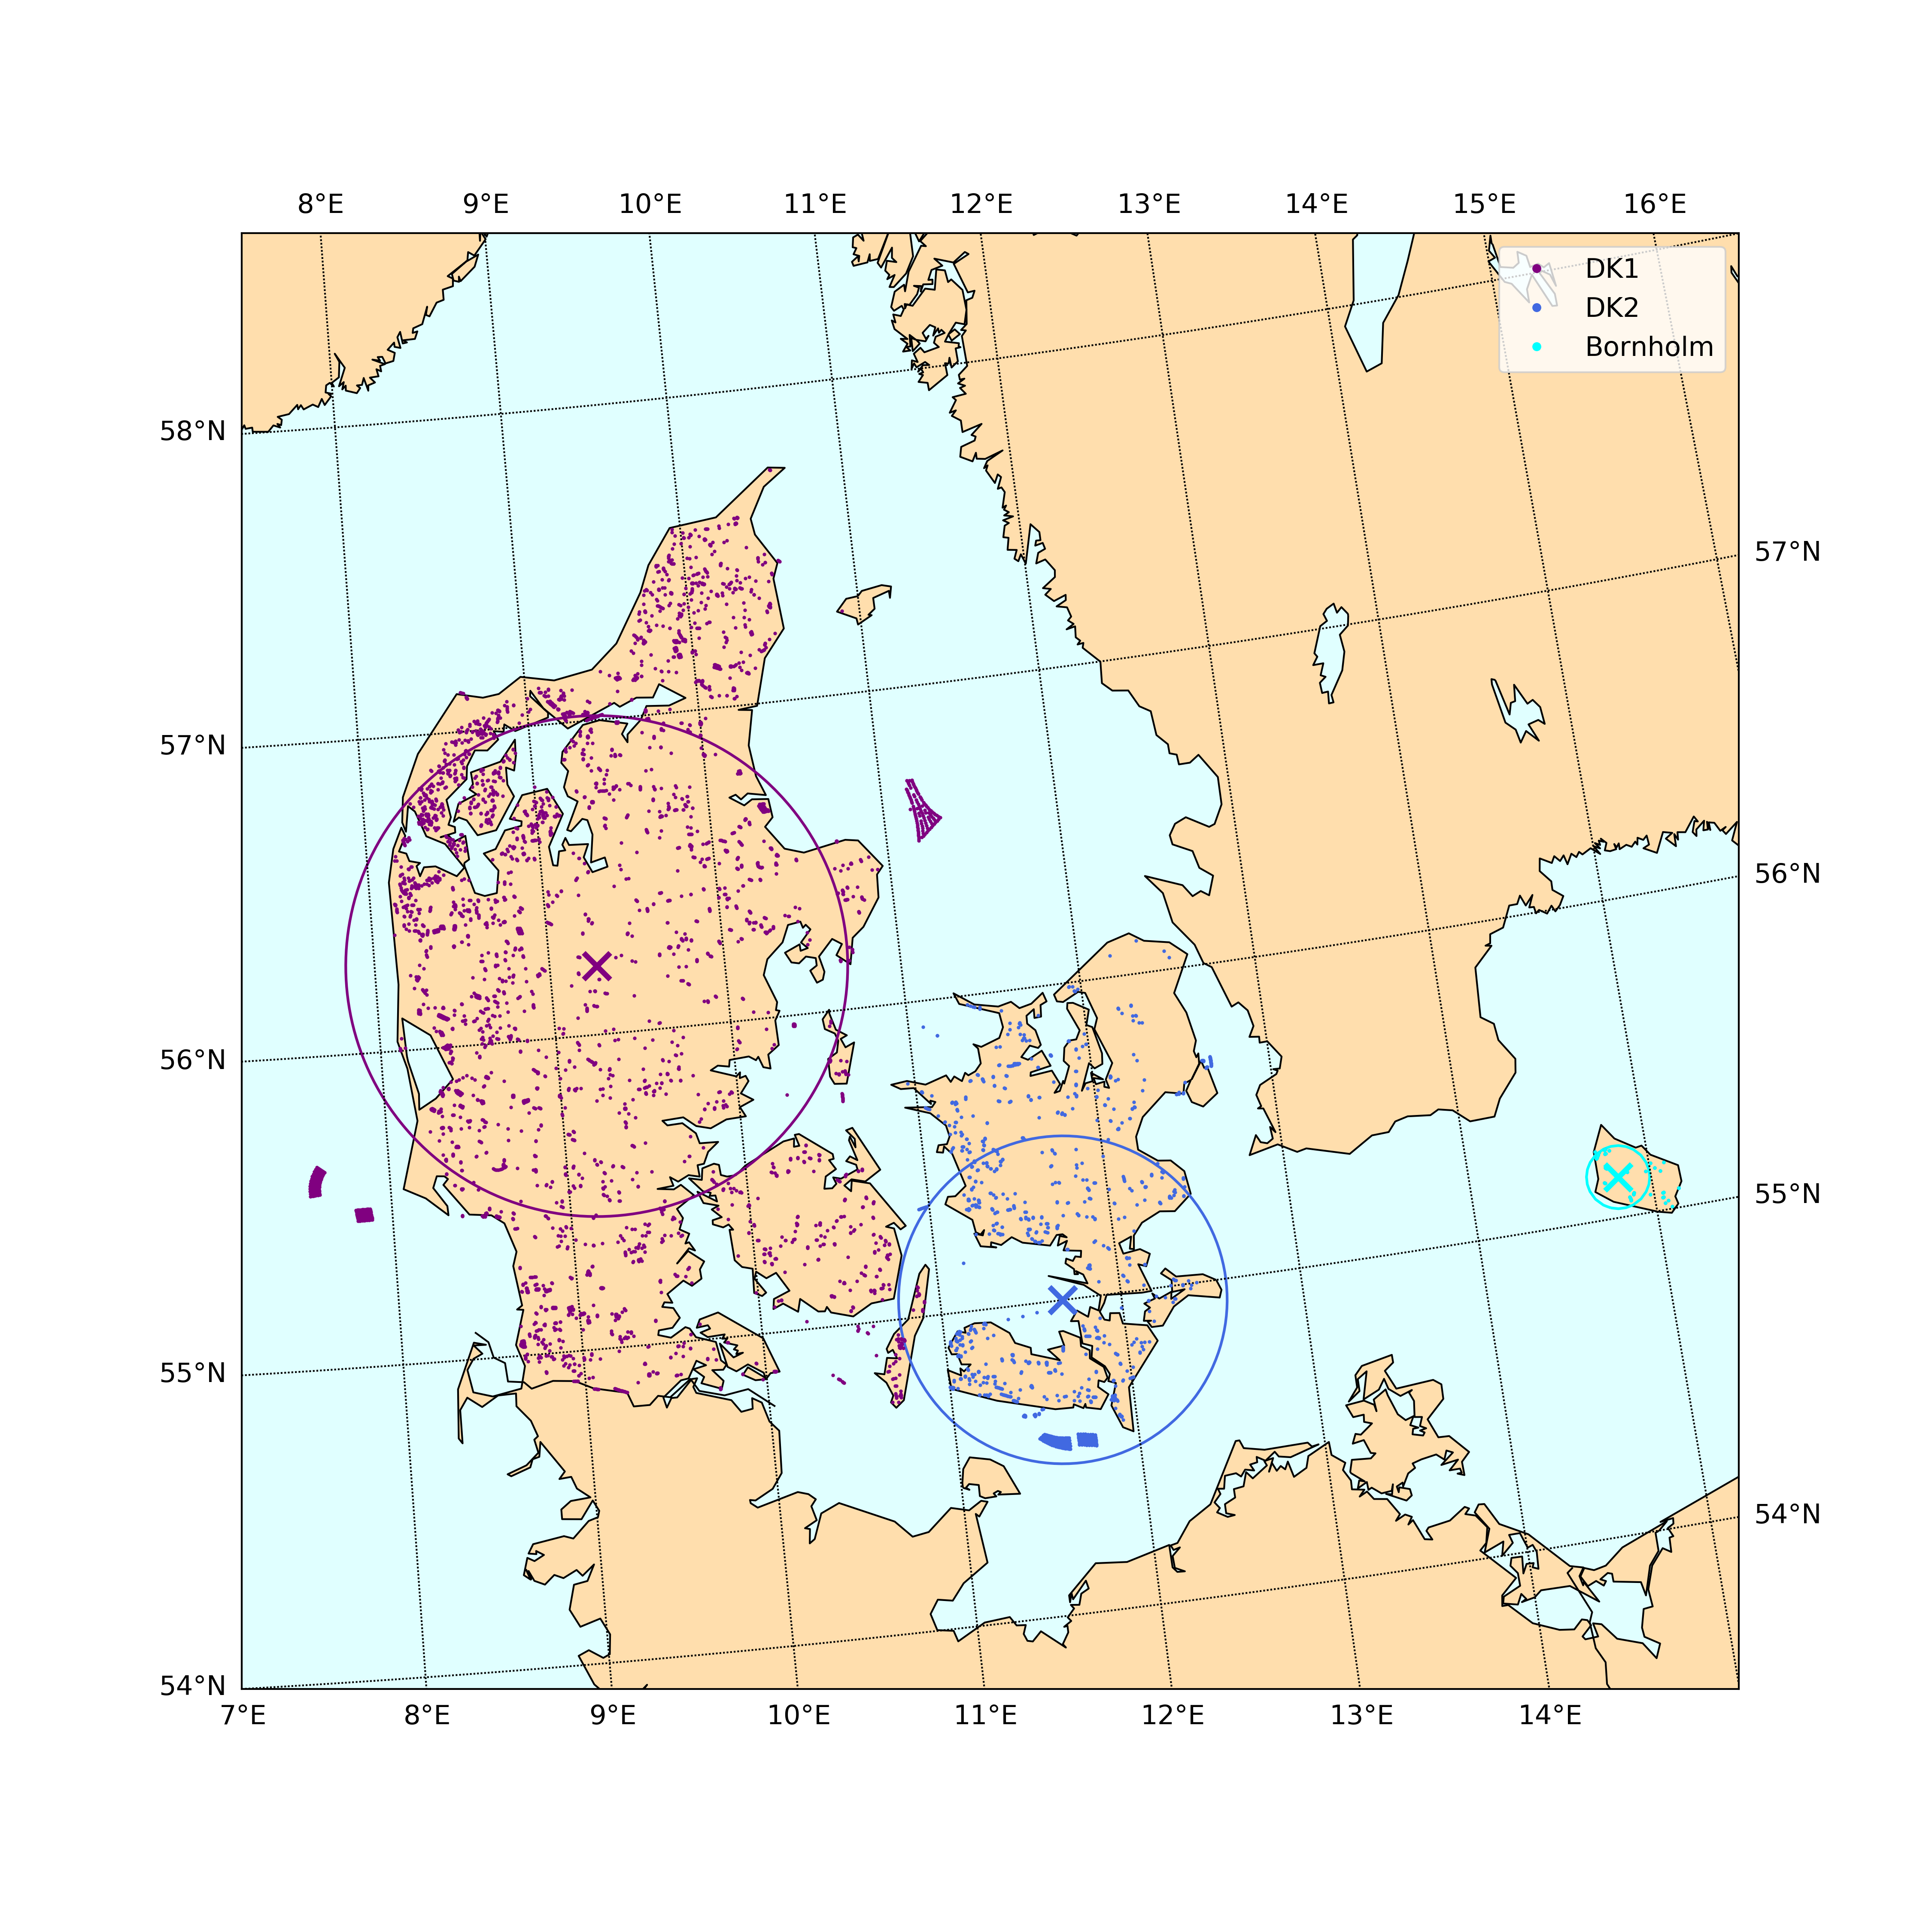
The circles indicate the mean distance from all wind turbines to the capacity-weighted center position of all turbines in a specific region.
If you’re interested, I uploaded the code on Github for public use:
Go to the source code in jupyter notebook format›
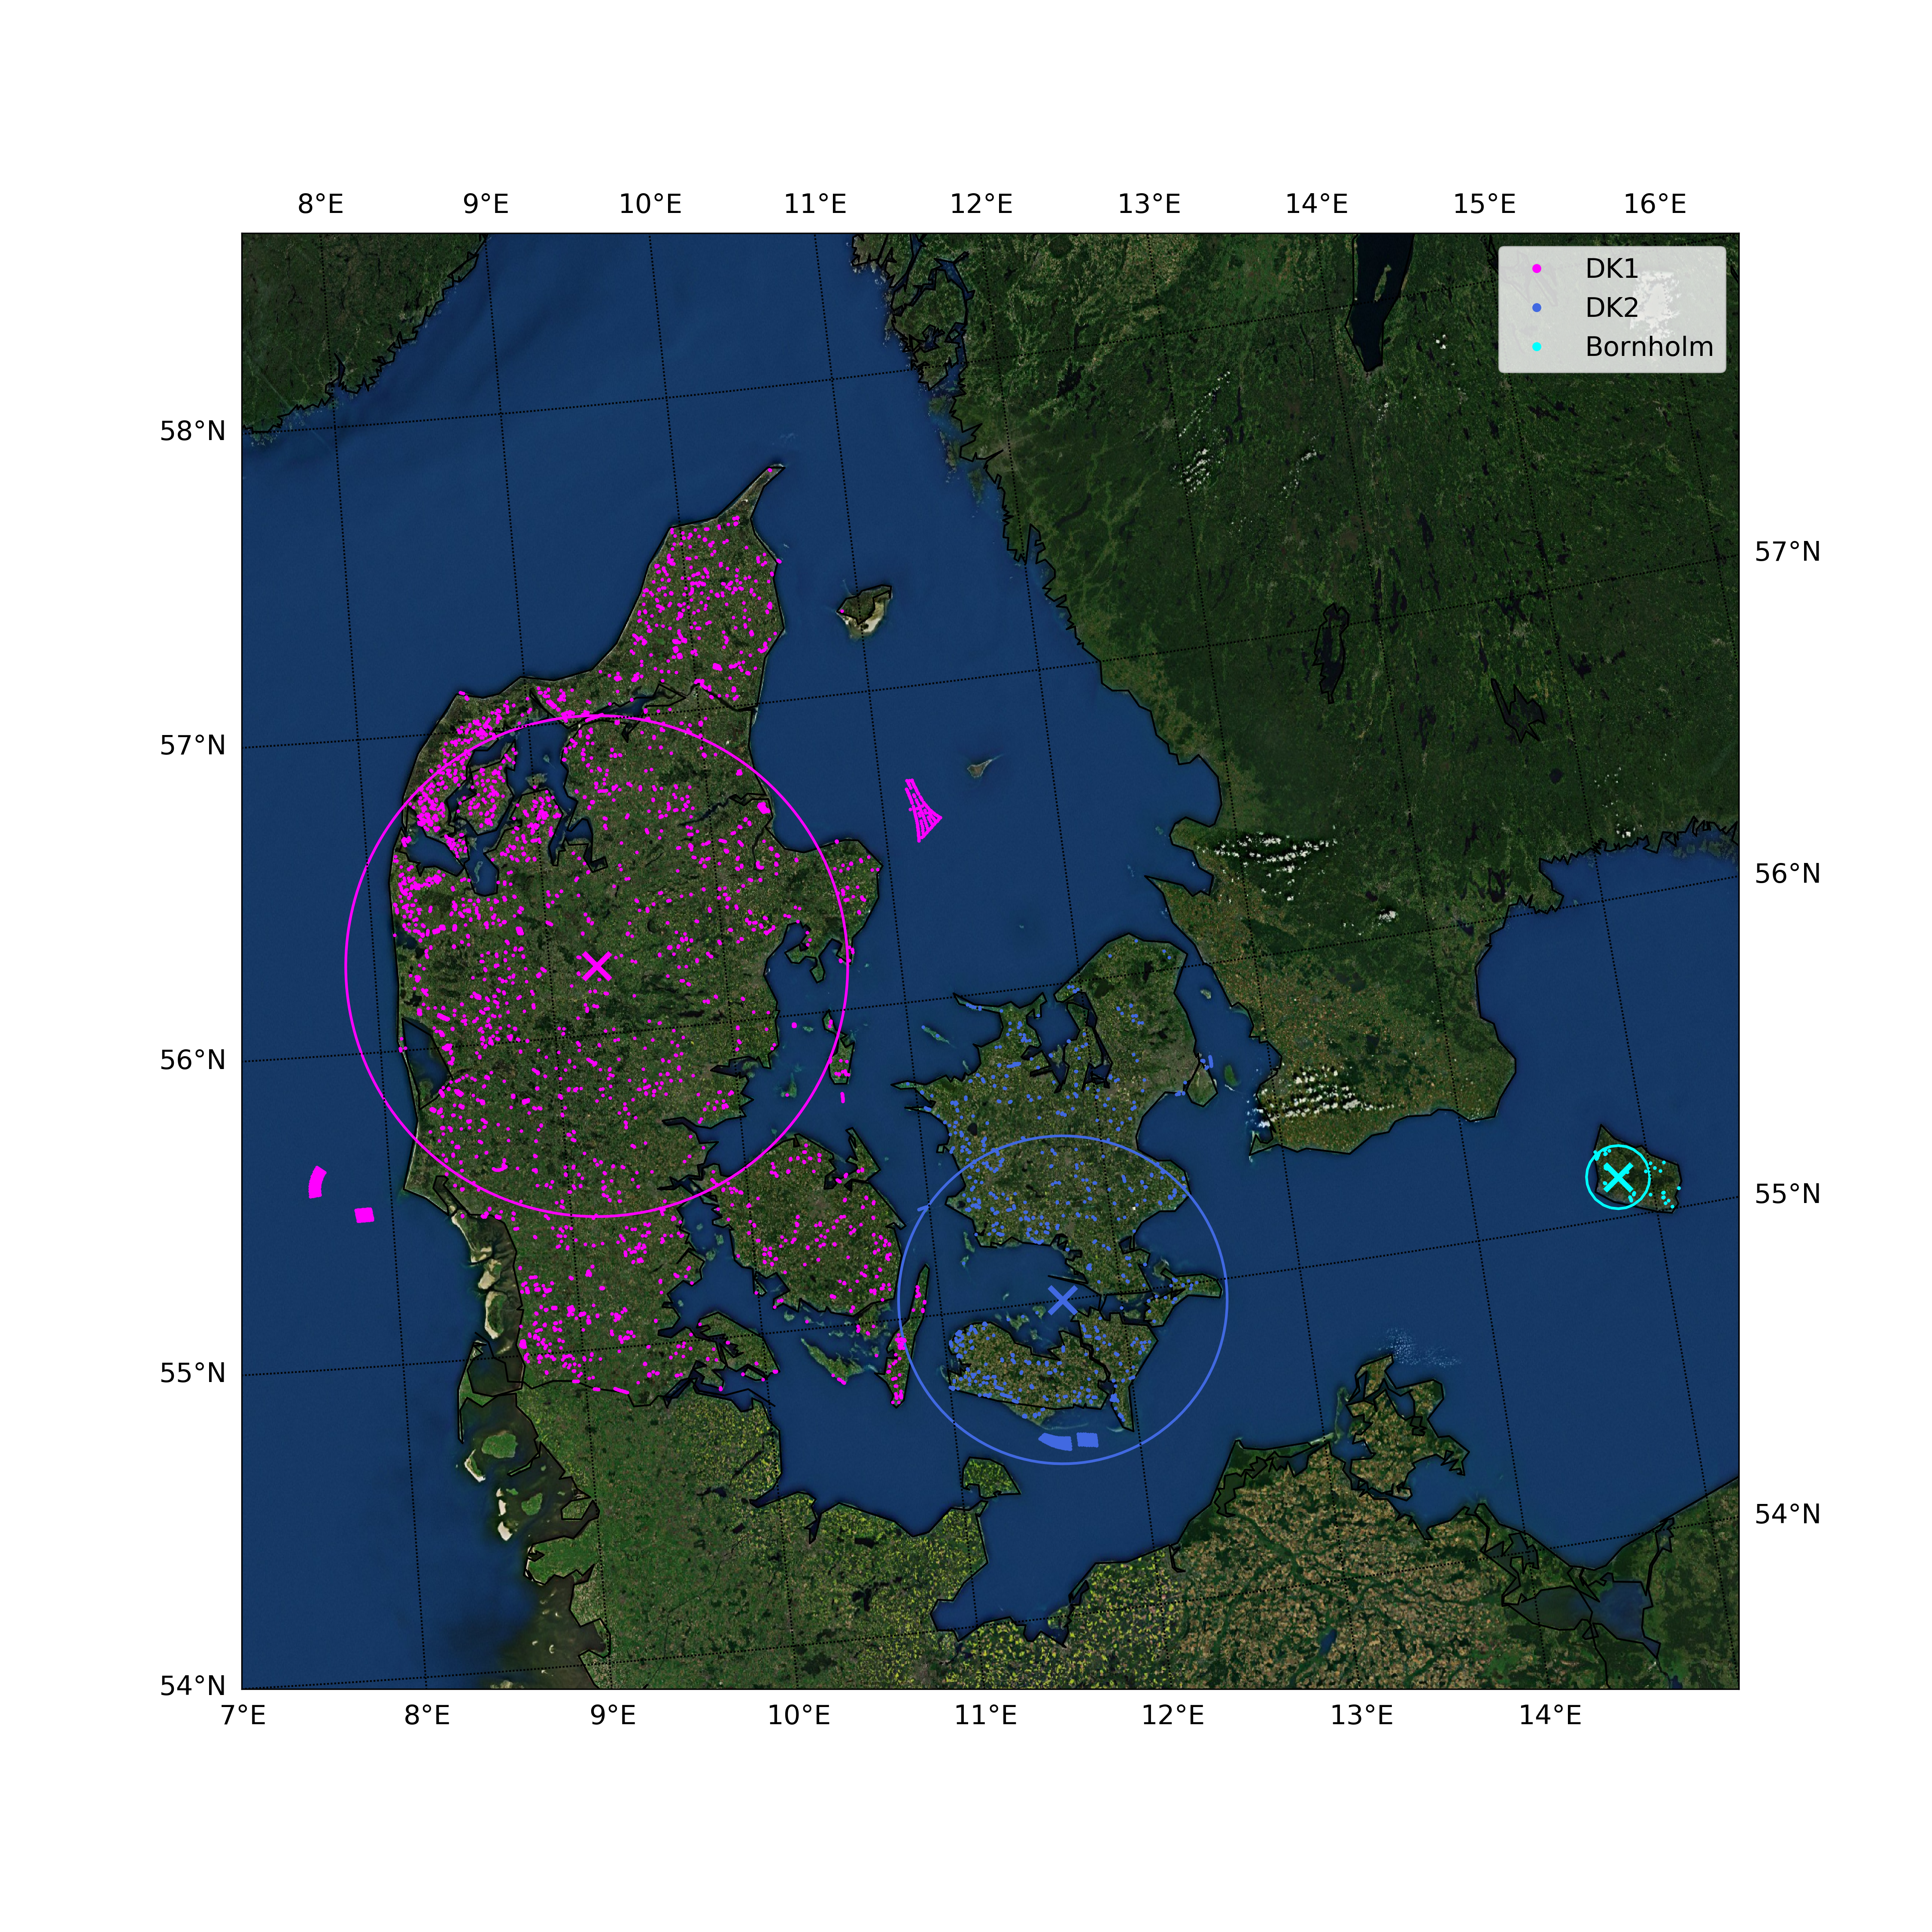
You can also get fancy, and make the following changes to load actual 2D imagery of the world:
# m.fillcontinents(color='navajowhite',lake_color='lightcyan')
# m.drawmapboundary(fill_color='lightcyan')
m.arcgisimage(service =  "ESRI_Imagery_World_2D", xpixels = 2000, alpha=0.05)
Here, I also changed the color of the DK1 turbine locations to ‘magenta’, in order so see them better:
BLOG