Gallery
A quick view at what can be done with SIGAME
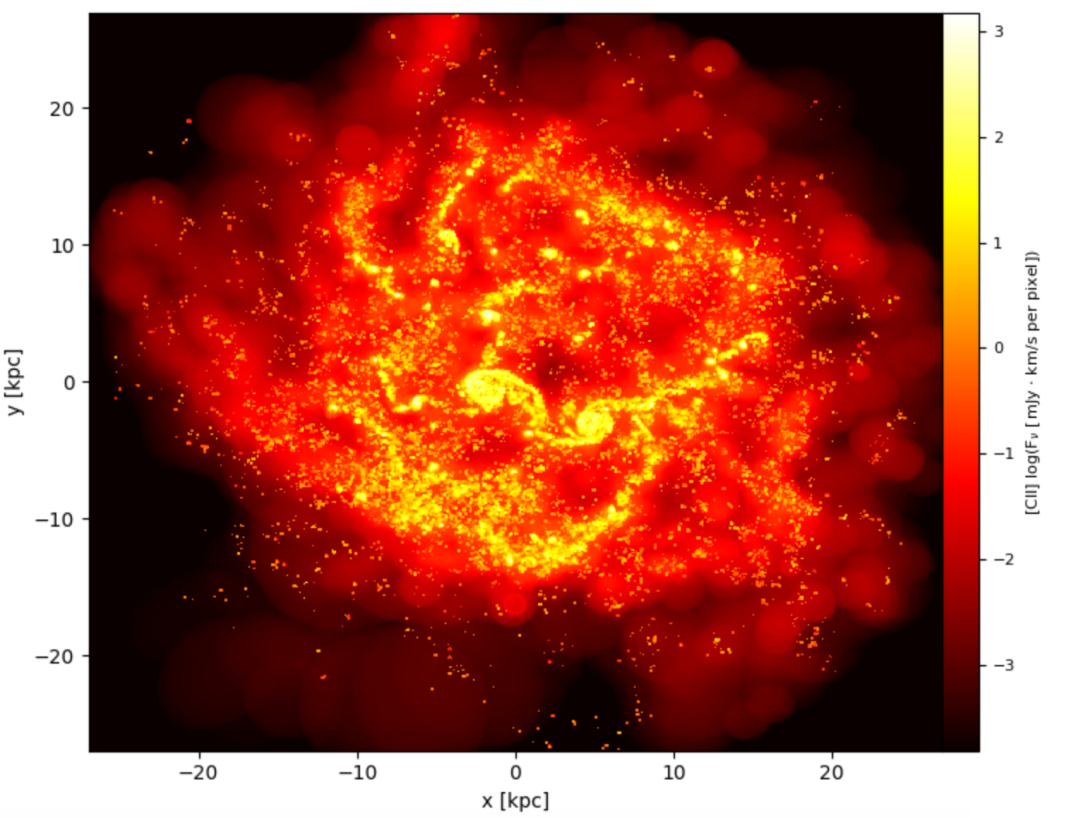
Line moment0 maps
SIGAME can present the line emission from a galaxy in a space-velocity datacube format, which can be integrated in velocity to generate moment 0 maps such as the one in above for a z~0 merger in [CII].
![[CII] moment0 map at z~0 with Herschel resolved resolved areas overlaid on top.](images/cii_map_resolved.png)
Synthetic resolved observations
By convolving a line emission map by the know beam size and shape of an instrument, a synthetic map can be generated and areas within a galaxy can be compared. In the figure above, this is done for a z~0 galaxy in [CII] emission, where the small yellow circles correspond to areas that Herschel would have been able to distinguish.
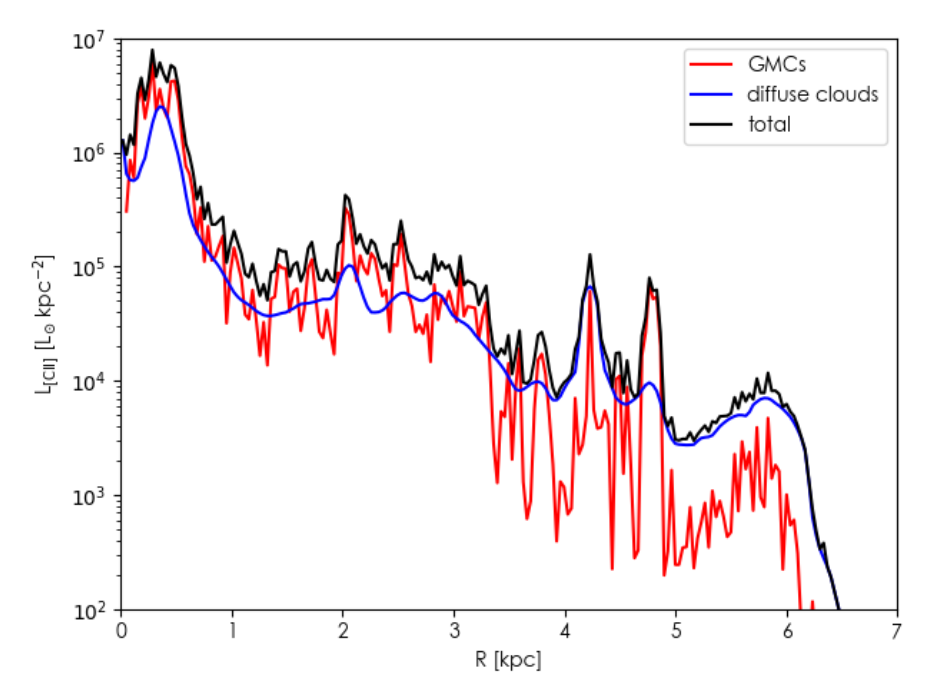
Radial profiles
The radial profile in [CII] emission is calculated for different ISM phases (GMCs vs diffuse gas) by integrating the datacube in circular annuli around the center of the galaxy.
![A diagnostic plot for the density and FUV flux in the ISM are connected to the [OIII]/[CII] line ratios for a group of z~0 galaxies. The overall mass-weighted values for density and FUV are shown as crosses.](images/diagnostic.png)
Line ratio diagnostic plots
In order to compare with resolved observations of multiple lines, we are working on producing diagnostic contour maps, that can be used to convert line ratios into e.g. density and Far-UV flux (G0), as shown in the above figure.
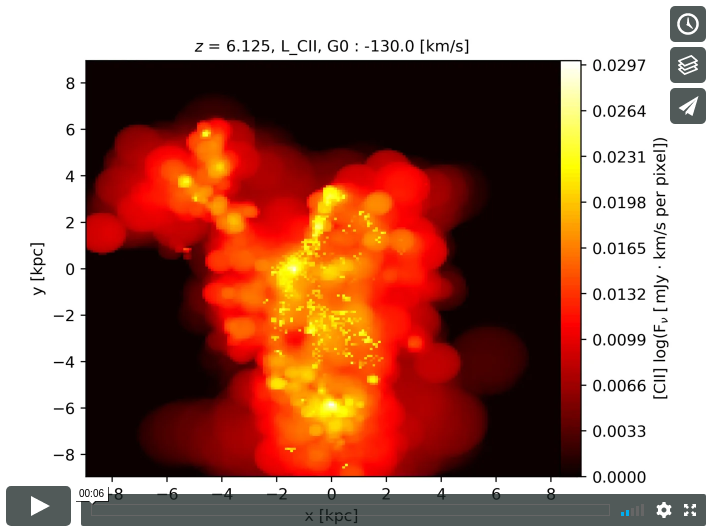
Stop motion through a galaxy
Movie made by scanning through the velocity channels of a datacube for a z~6 galaxy, revealing the dynamics of a rotating disk.
Table output
In addition, SIGAME will take your galaxy (or galaxy sample) and collect numbers on galaxy global properties such as SFR, stellar mass, ISM mass, SFR-weighted metallicity etc. in one table stored as a dictionary. Then, line luminosities can be derived and added to that table for further use. However, the real power of SIGAME lies in the resolved spectral datacubes that can be converted into line profiles, line maps and much more, as shown above.